
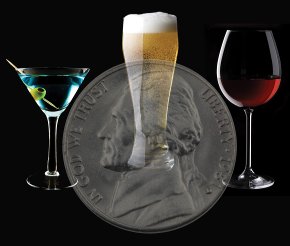
Neglected and Outdated State Beer Taxes
 |
Bottom of the Beer Barrel: 12 States With Worst Tax Rates
| State |
Current Tax Rate
(per gallon)
|
Year of Last Increase | Decrease in Real Value | Revenue @ 10 cents per drink increase |
| Wyoming | $0.02 | 1935 | 94% | $15.3 million |
| Pennsylvania | $0.08 | 1947 | 90% | $333 million |
| Kentucky | $0.08 | 1954 | 87% | $87.2 million |
| Idaho | $0.15 | 1961 | 86% | $33.4 million |
| North Dakota | $0.16 | 1963 | 86% | $20.9 million |
| West Virginia | $0.18 | 1955 | 88% | $45.2 million |
| Michigan | $0.20 | 1966 | 85% | $216 million |
| Louisiana | $0.32 | 1948 | 89% | $129 million |
| Mississippi | $0.46 | 1950 | 89% | $80.2 million |
| Georgia | $0.48 | 1964 | 86% | $201 million |
| Wisconsin | $0.06 | 1969 | 83% | $167 million |
| Missouri | $0.06 | 1971 | 81% | $150 million |
About the Worst Beer Tax Data
The table above provides the underlying data for the twelve states with the "worst" beer tax rates in the nation. To find these states, three criteria were used: current tax rate (per gallon), the year of last increase, and the percent decrease in real value. Three states: Wyoming, Pennsylvania, and Kentucky ranked at the bottom of the list for all three criteria. Seven states: Idaho, North Dakota, West Virginia, Michigan, Louisiana, Mississippi, and Georgia ranked in the bottom for two of the criteria (year of last increase and decrease in real value). An additional two states, Wisconsin and Missouri, complete the list of the five states with the lowest beer tax rates. The amount of potential revenue from increasing each state's tax rate by 10 cents per drink was generated using the Alcohol Justice Alcohol Tax Calculator.
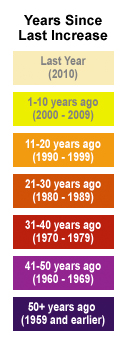
Years Since Last Increase
What you could buy for $1.00 in 1950 would cost you $8.93 in 2008. This is because over time, inflation causes prices to rise. However, beer taxes are not linked to inflation. Instead, they remain constant until they are increased through policy action. Some states have not updated their excise tax rate for decades, which means inflation has taken a huge bite out of its value. More than half of the states have not increased their excise tax rate in twenty years or more. Because of this, state tax revenue collections suffer.
Because beer tax rates are not indexed to inflation, their real value drops over time. In other words, excise tax revenues essentially decline each year. Inflation has diminished the value of each state's beer tax since the year it was last raised. The erosion of each state's beer tax rate was calculated as the percent change between the excise tax rate and its real value, when deflated from 2009 back to the year it was last raised. For instance, California's beer tax rate of 20 cents per gallon has lost 37 percent of its value since it was last raised in 1991.
Data Sources
1. Year of last increase, as of 2010.
2. Excise tax rates were deflated using annual CPI data through 2009, the most recent year for which annual inflation data were available.
3. State beer excise tax rates and historical changes were obtained from the Brewer's Almanac and Adams Beer Handbook.
4. Alcohol Justice Alcohol Tax Calculator
TAKE ACTION
Don't mortgage the future.
Bring alcohol fees into the present & fund our kids at $500m a year.
TAKE ACTION
TO MODERNIZE CA
ALCOHOL TAXES
CA lawmakers want to:
♦ sell more alcohol at colleges
♦ market to underage students
♦ let the excise tax decay
TELL THEM THERE'S A BETTER WAY
IN THE DOGHOUSE
Big Alcohol Bids for Underage College Students, Cal State Willing to Sell
AB 840 is moving steadily through the legislature, with few aware of its true impact: to vastly increase the alcohol industry's ability to paste ads all over Cal State campuses, and reach its 180,000 underage students.
READ MORE...
LEGISLATIVE ACTIVITY
 CA Alcohol Legislation
All legislation related to alcohol policy in Sacramento. Includes analysis & position letters from AJ & CAPA.
 NEW! CA Opioid Legislation
CA bills concerning opioid and overdose prevention, recovery, and treatment.
 Nationwide Legislative Tracking
State-by-state and federal bills relevant to AJ projects/campaigns.
ADVOCACY TOOLS
Help us hold Big Alcohol accountable for the harm its products cause.
| GET ACTION ALERTS AND eNEWS |
STAY CONNECTED    |
CONTACT US 24 Belvedere St. San Rafael, CA 94901 415-456-5692 |
SUPPORT US Terms of Service & Privacy Policy |